11 Nov How to Maximize the Value of NFL Sponsor Signage for Broadcast
Using Zoomph’s broadcast measurement and AI-powered logo detection technology, we analyzed every televised game from the first two weeks of the 2025 NFL season to identify where and how signage achieves the greatest on-screen exposure. This study helps NFL teams and brands investing in NFL stadium signage gain a deeper understanding of the true value of in-venue assets on TV and enables brands to invest more strategically in high-visibility placements that drive measurable ROI.
Zoomph’s AI-powered broadcast logo detection technology processed thousands of frames per game across multiple broadcast feeds. Each logo pickup and duration was recorded, categorized by stadium location, and benchmarked across the league.
NFL Broadcast Visible Signage Rankings (Weeks 1 + 2)
| Rank | Brand | Stadium | Week | Pickups | Logo Duration |
|---|---|---|---|---|---|
| 1 | MetLife | MetLife Stadium | 1 | 61 | 03:49:00 |
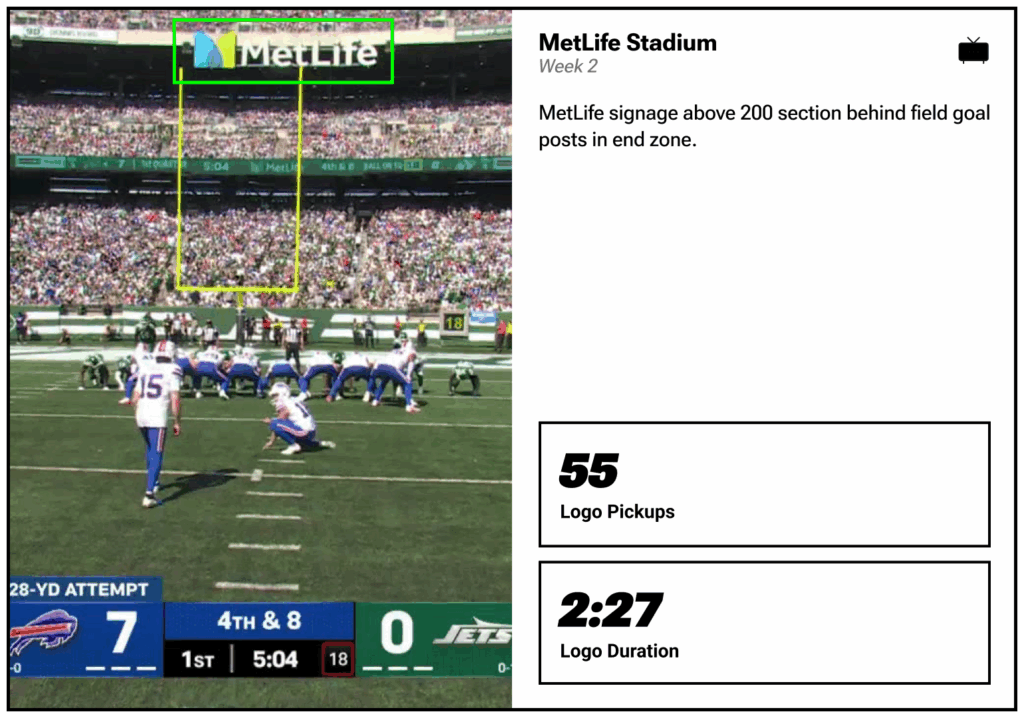
| 2 | MetLife | MetLife Stadium | 2 | 55 | 02:27:00 |
| 3 | T-Mobile | Lumen Field | 1 | 53 | 02:35:00 |
| 4 | T-Mobile | GEHA Field | 2 | 49 | 02:41:00 |
| 5 | Bank of America | Northwest Stadium | 1 | 47 | 01:28:00 |
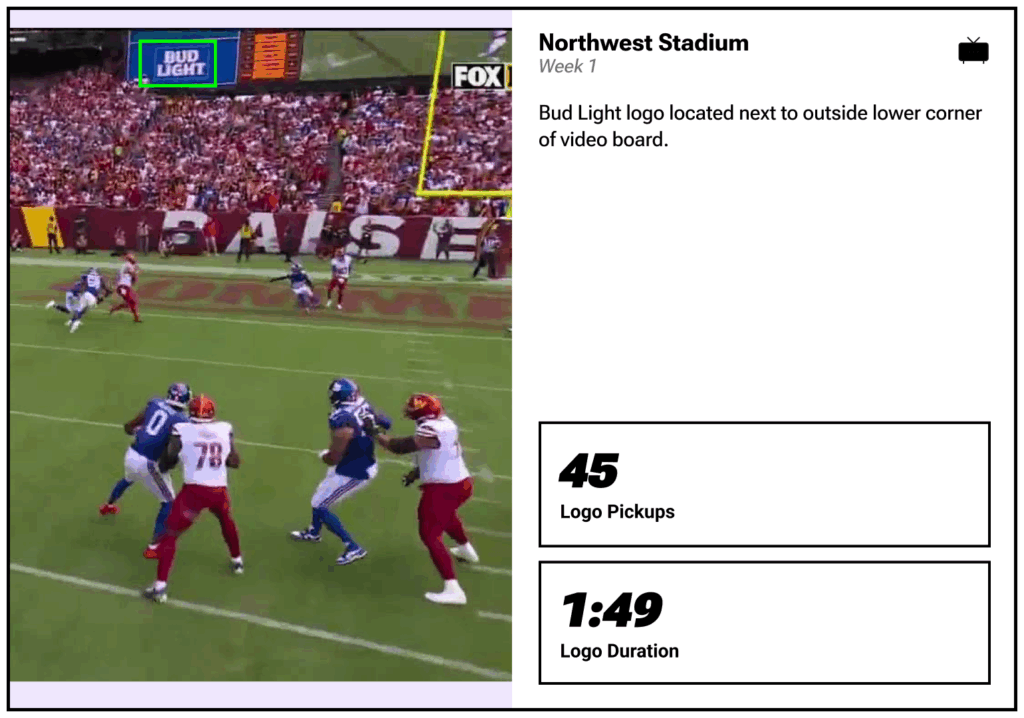
| 6 | Bud Light | Northwest Stadium | 1 | 45 | 01:49:00 |
| 7 | Bud Light | GEHA Field | 2 | 39 | 01:43:00 |
| 8 | Mercedes-Benz | Mercedes-Benz Stadium | 1 | 38 | 01:35:00 |
| 9 | The Salvation Army | AT&T Stadium | 2 | 38 | 01:04:00 |
| 10 | T. Rowe Price | M&T Bank Stadium | 2 | 36 | 01:43:00 |
End Zone Dominance: End zone signage outperforms all other in-stadium placements, appearing in nearly every top exposure. End zones continue to reign supreme as the most valuable real estate for broadcast-visible signage. Nearly every top logo exposure during the first two weeks of the NFL season originated from placements either directly behind the goalposts or along the corners of the end zone. Shots from sideline and sky-cam angles consistently feature these areas during key game moments – touchdowns, field goals, player celebrations, and coach reactions – creating high-frequency, long-duration visibility. For example, MetLife’s end-zone signage appeared 61 times in a single broadcast, totaling nearly four minutes of on-screen exposure, the highest in the study
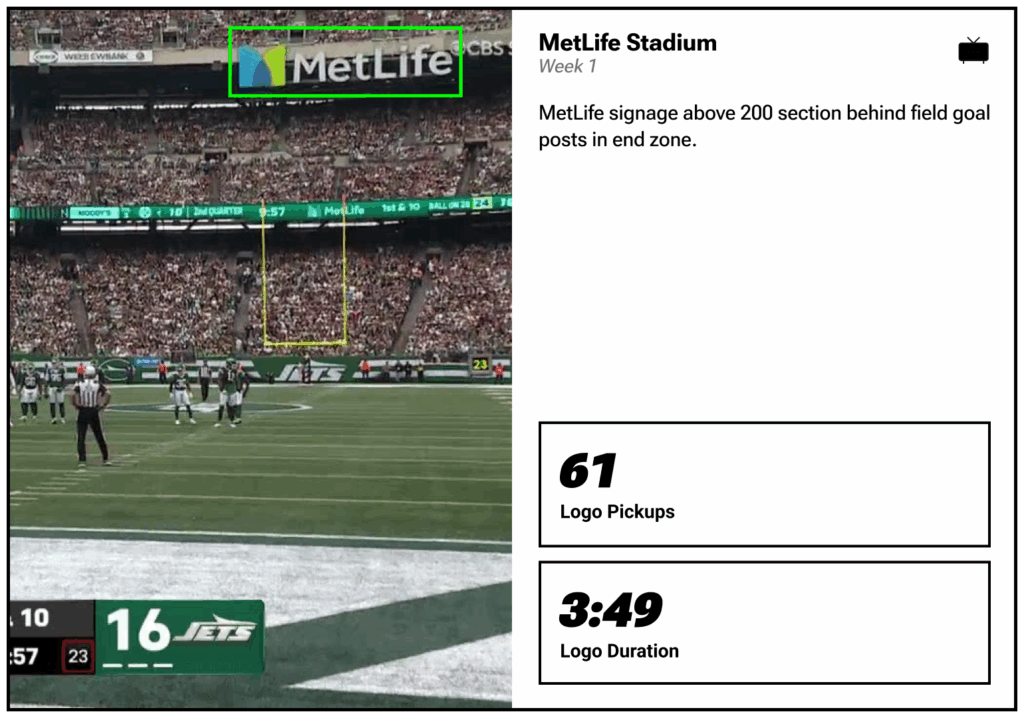
MetLife Stadium’s end-zone signage topped all exposures with 61 on-screen pickups and nearly four minutes of visibility.
Camera Angle is King: Sky cam and sideline shots facing the end zone deliver the most logo pickups. The direction and elevation of the broadcast camera have a major impact on logo exposure. Signage positioned in line with end-zone-facing cameras – especially those that capture player and coach reactions or crowd energy – saw significantly higher pickup rates than sideline or upper-deck assets. Sky-cam shots looking toward the end zone generated the most repeat exposures, while field-level sideline shots often included end-zone walls and tunnel entrances in frame. This proves that optimal placement is less about sheer size and more about strategic positioning within broadcast sightlines
Sky-cam and sideline angles maximize logo visibility across broadcast frames.
Lower = Louder: Lower scoreboard and field-level signage increases exposure frequency. When it comes to scoreboard and fascia signage, height matters. Logos placed closer to the field level were picked up more frequently than those mounted higher in the fan area or upper decks. For example, with the Washington Commanders at Northwest Stadium, the two partners positioned nearest the field on the end-zone scoreboard were also the two most-frequently seen by viewers. Lower placements naturally align with broadcast camera height, keeping logos inside the visual frame longer during gameplay and replays – especially in wide-angle shots of the end zone.
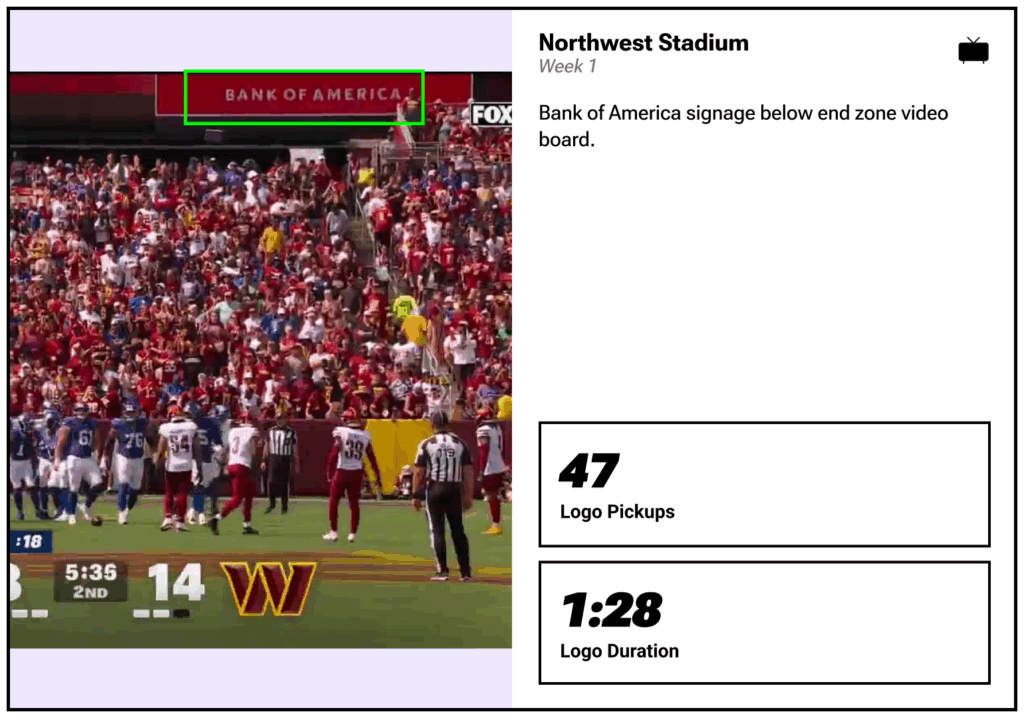
Lower scoreboard placements align naturally with broadcast camera height.
Tunnel Visibility: Player tunnel branding benefits from broadcast cutaways and wide shots. Player tunnels and entrances represent an undervalued but high-potential broadcast opportunity. During the first two weeks, Zoomph detected multiple instances of signage near tunnel areas being featured as cameras zoomed out for crowd or team-entry shots. At Mercedes-Benz Stadium, for example, a single logo at the player entrance tunnel was captured 38 times, totaling more than a minute and a half of screen time. These placements benefit from being in dynamic, high-emotion moments – introductions, pre-kickoff shots, and post-game reactions – where logos share the frame with key players and brand storytelling is strongest.
Branded player tunnels like Mercedes-Benz Stadium’s capture high-impact visibility during pre-game and broadcast crowd shots.
Field-Level Wins: Wall signage near field goals and extra points drives strong visibility, especially during scoring plays. Consistent visibility often comes from reliable, repeatable broadcast moments. Field-level wall signage near the goalposts – especially along the bottom edge of the end zone—proved to be among the most dependable exposure drivers. Partners like T. Rowe Price and The Salvation Army both achieved notable screen time thanks to static logos located within these zones, frequently appearing during field goals, extra points, and post-play replays. These assets deliver value through repetition and situational relevance, making them one of the most effective “set-and-forget” placements for both teams and sponsors.
Prioritize end zone and tunnel signage for brand exposure. End zones are not just for touchdowns – they’re prime branding real estate. Given that the majority of top exposures came from end-zone signage, teams should consider packaging and pricing these placements as premium assets. Positioning logos directly behind the uprights or along the corner angles ensures frequent appearances in game-defining moments like scores, celebrations, and player interviews. Even modestly sized end-zone signs can outperform larger mid-tier placements due to superior camera coverage.
End-zone signage remains the most valuable broadcast-visible real estate
Rethink Scoreboard and Ribbon Board Strategy: Logo height and sightline alignment matter more than size or scale. Teams should audit their scoreboard placements to ensure logos sit closer to the field, especially in areas visible from sideline and end-zone camera angles. High-mounted signage, while great for in-stadium audiences, often falls outside broadcast framing. Lower-tier scoreboard panels and corner fascia boards yield a higher return on exposure and should be highlighted as broadcast-visible assets in sales decks.
high-mounted scoreboard signage provides limited TV visibility compared to lower-tier assets
Use Zoomph Data to Quantify Asset Value: Every stadium, camera angle, and production style is unique – so rather than assuming value, teams can validate it. Zoomph’s broadcast logo detection enables organizations to measure exposure frequency, on-screen duration, and contextual relevance for each sign. By integrating this data into rate cards and sponsorship recaps, properties can confidently position high-performing zones (like end-zone walls or tunnel signage) as premium, data-verified assets.
Build Tiered Pricing Models Based on Visibility: Teams should evolve beyond flat signage pricing and embrace a data-tiered model that reflects true broadcast value. End-zone walls, field-level corners, and tunnel areas can serve as Tier 1 broadcast-visible assets, while upper-deck or non-TV-facing signs can fall under Tier 2 or 3. This approach not only maximizes revenue but also strengthens transparency with partners by linking price directly to measurable visibility outcomes.
Invest in Camera-Facing Placements: Brands looking to make an impact should target assets consistently within broadcast frames. End-zone walls, lower scoreboard panels, and tunnel entrances offer the best value per dollar spent. Repetition drives recall – logos in these zones were seen dozens of times per game, with the top-performing placements exceeding 3–4 minutes of total screen time during a single broadcast.
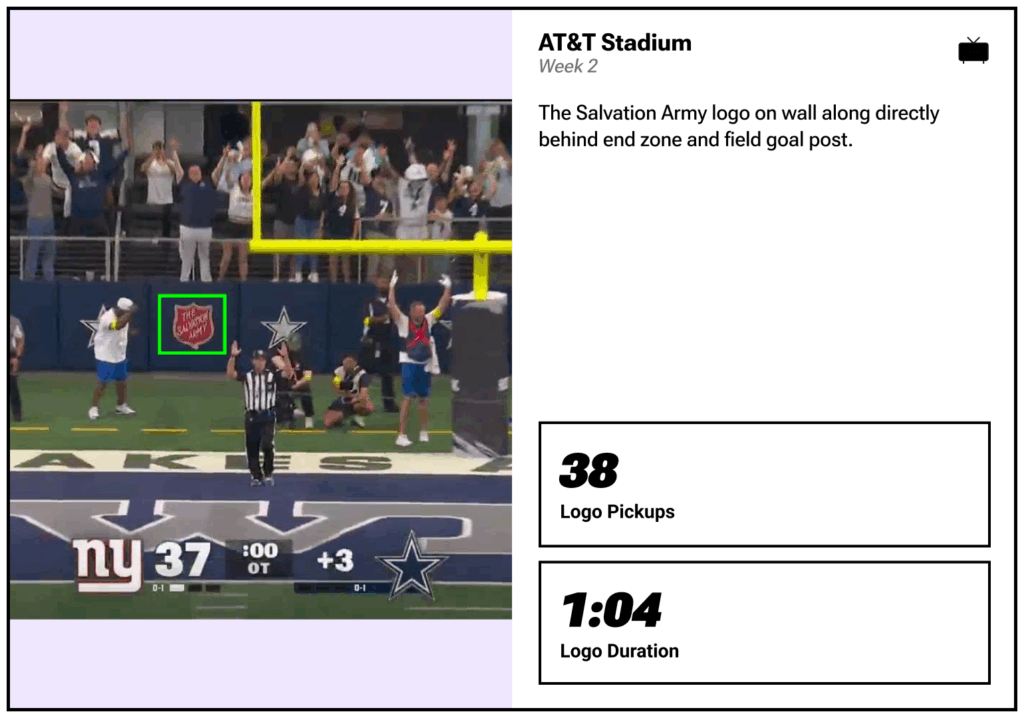
Camera-facing wall signage like The Salvation Army’s delivers reliable, repeatable broadcast exposure.
Prioritize Consistency Across Markets: Brands active in multiple NFL markets can use broadcast analytics to benchmark stadium-to-stadium performance. Partners like T-Mobile and Bud Light achieved top-tier exposure in multiple venues, showing that consistent placement strategy (rather than venue-specific design) leads to sustained value. When buying across teams, sponsors should request historical broadcast data to verify how similar placements perform elsewhere.
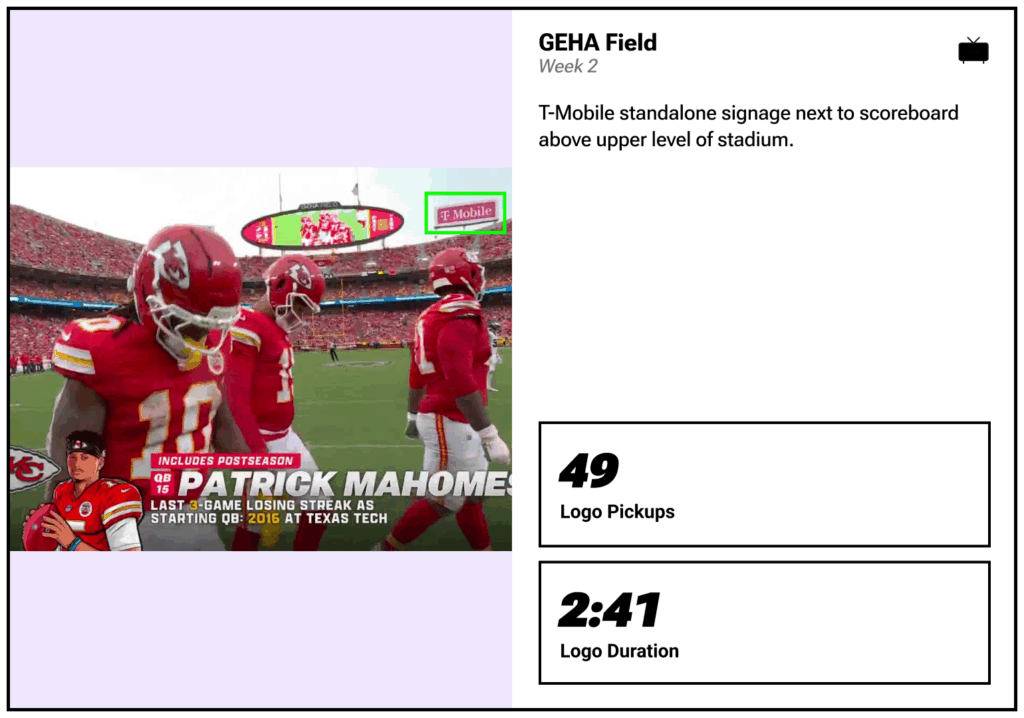
Consistent brand placement across venues ensures sustained broadcast visibility.
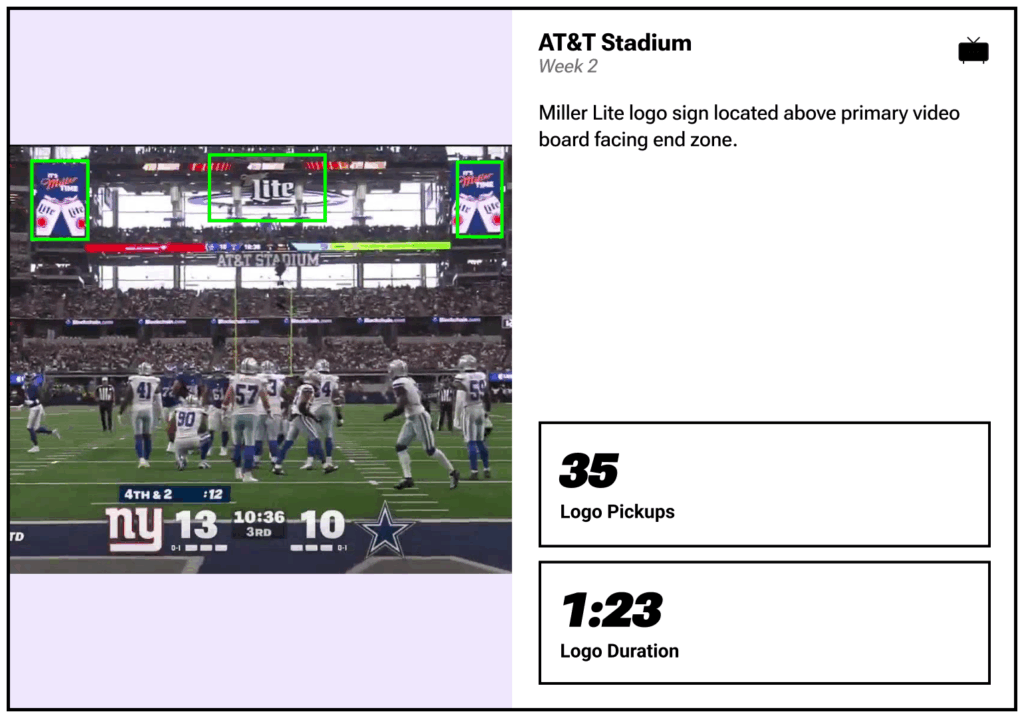
Align Visual Design with Camera Framing: Even high-frequency placements can lose impact if logos aren’t broadcast-optimized. Brands should test contrast, color, and size against live broadcast frames to ensure legibility from typical sideline camera angles. Clean, bold marks with minimal text perform best when viewed through television compression or highlight replays.
Bud Light’s end-zone signage shows how clean, high-contrast designs maintain legibility and impact across broadcast angles.
Measure, Benchmark and Invest With Confidence: Brands should no longer rely on impressions alone to justify sponsorship ROI. By using Zoomph’s broadcast analytics, marketers can move from anecdotal to empirical evaluation—comparing exposure time, pickup frequency, and relative asset performance across games. This data helps justify renewals, renegotiations, and creative activation opportunities with precision.
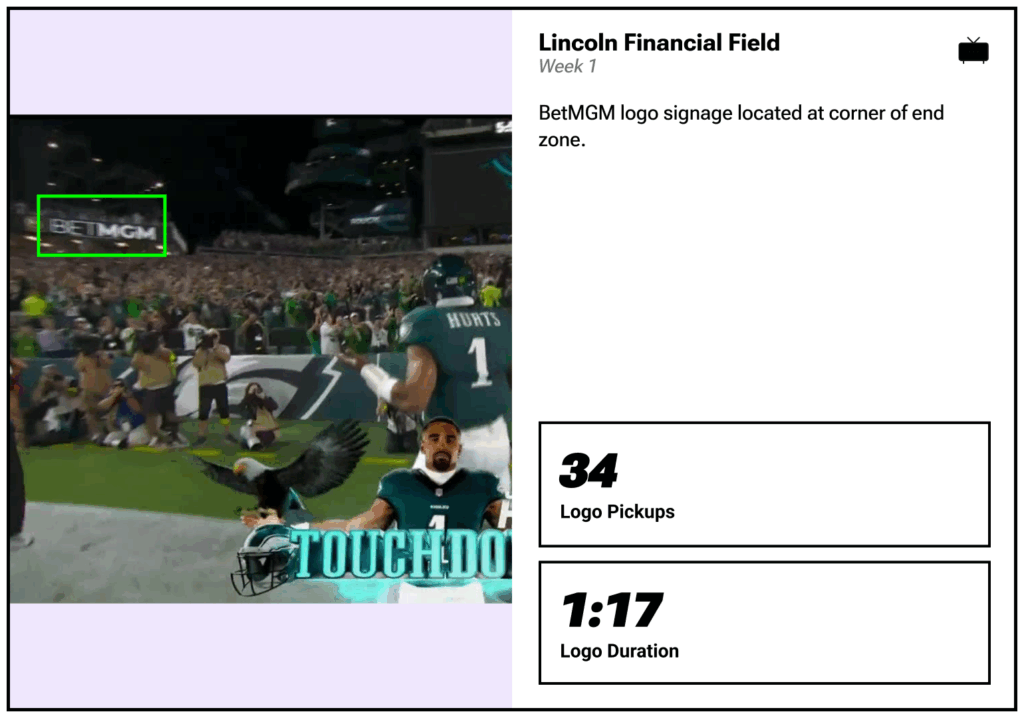
Corner placements, like BetMGM’s at Lincoln Financial Field, maximize exposure from multiple broadcast angles
Integrate Broadcast, In-Venue and Social: Many of the same brands that dominate TV visibility also lead in social amplification. The most effective sponsorship strategies use broadcast exposure as the foundation and build digital storytelling around it. Teams and brands can collaborate to synchronize in-game moments, highlight features, and digital recaps that multiply the value of those same broadcast-visible assets.
Zoomph is the sports and entertainment analytics platform trusted by brands, teams, leagues, and agencies to measure the true impact of sponsorships and fan engagement across social media, broadcast, and in-venue activations.
Our AI-powered logo detection, audience analytics, and real-time reporting tools make it easy to track, benchmark, and optimize performance – so you can clearly see the value your partnerships deliver.
👉 Ready to quantify your sponsorship ROI and maximize your visibility? Contact Zoomph today to start measuring what matters most.