06 Aug The Bucs Won On The Field, But Who Won Off the field?
Researched & written by Naomi Cutter
I. Introduction
The 2020 NFL season was unlike one we had ever seen. Stadiums were empty, players and coaches were wearing masks on the sidelines, and positive COVID-19 tests meant games being cancelled and rescheduled almost weekly. Among the changes last season was the way in which teams connected with their fans. With empty seats and a lack of events, teams relied more heavily on social media to keep their fans engaged during games as well as throughout the week. Sponsorship deals also played a large role in this push for social media, as brands had to pivot from in-person stadium activations to more digital and social promotions. In this report, I analyze a dataset that contains social media posts from Instagram, Twitter, and Facebook across all 32 teams throughout the 2020 NFL season. I investigate what variables have an effect on the engagement rate of a given post, what these effects are, and how this information can be used going forward.
II. Exploratory Data Analysis
This dataset is rich with statistics and information. After cleaning up the data and narrowing it down to the variables I was interested in, I began organizing the data into different subsets by platform (Twitter, Facebook, and Instagram). Additionally, I created two new binary variables to be appended to the dataset: “rookies” and “playoffTeam”. The new playoff team variable takes the value 1 if a team made the playoffs, and 0 if the team did not. The rookie variable functions in the same way. I classified the following teams as those whose season featured a big-name rookie who created headlines (this was discretionary). Note – all content was analyzed in aggregate and not delineated between rookie-related and non-rookie-related.
- Cincinnati Bengals – Joe Burrow
- Miami Dolphins – Tua Tagovailoa
- Minnesota Vikings – Justin Jefferson
- LA Chargers – Justin Herbert
- Washington Football Team – Chase Young
- Pittsburgh Steelers – Chase Claypool
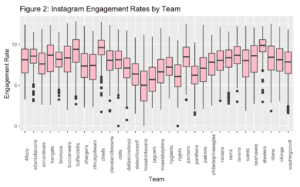
This plot depicts the spread of engagement rates on Instagram throughout the season for each of the 32 teams. Once again, the pink boxes represent the middle 50% of the data. The first thing to note here is which teams stand out with not only higher medians, but also smaller interquartile ranges. That would be the Chiefs, Packers, and Steelers. This indicates that these teams not only outperformed the rest on achieving a high engagement rate; they did it consistently throughout the season. The denser the middle 50% of the data is, the less variance there was in the engagement rates of the posts for that team. Of course, it likely helped that these teams won (a lot), but there are plenty of other factors that could have been contributing to these teams’ success on social in addition to the work of the club’s social team (more to come on this later). For example, the Bucs won the Super Bowl, and they have a competitive median engagement rate, but their IQR is about twice as large as the Steelers’. The same is true for the Bills, who had a strong presence on social media this year as fans engaged with their two emerging stars, Josh Allen and Stefon Diggs. Thus, while still demonstrating strong presence on social, these two teams’ fan bases may not have been as consistently engaged with the team’s content as were the followers of the Steelers and the Chiefs.
III. Modeling
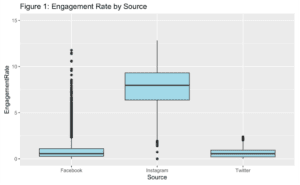
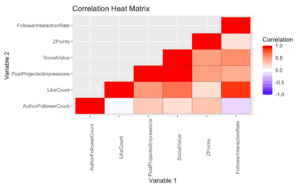
In this section I explore the significance of the variables and what effect they have on engagement rate, by platform. Part of my goal in exploring this dataset was to investigate the validity of performing predictive modeling for this type of data, and I found that predictive modeling was most effective with data from Twitter and was more difficult to predict on Instagram (this likely relates to Figure 1 and the larger variance in engagement rates we see on Instagram versus Twitter). This is good information to have for future years, but for this report, I performed inference modeling to understand what variables were most significant this past season. Once I obtained those variables, I took a deeper dive into quantifying what the effects were. Prior to building my first model, I explored the possibility of multi-collinearity, and found that there was a strong correlation between two pairs of explanatory variables, as can be seen in this correlation heat matrix.
The primary selection technique that I used throughout my analysis was best subset selection. This is a selection technique that easily allows statisticians to visualize different models by showing the ideal combination of variables that results in the highest adjusted R2. I created separate models for each platform.
IV. Results and analysis
In general, the results-oriented variables were not significant when modeling engagement rate. This includes variables such as the number of Twitter retweets, Facebook reactions, and Instagram comments. The majority of the other variables that were related to the actual content of the post and the account itself, such as the content type, the like count, and the follower interaction rate were all significant. I aimed to maximize R2 while keeping the model small and simple.
The two variables that I focused on were the binary variables I created, “rookies” and “playoffTeam”. The following table summarizes the results of my findings:
It is interesting to note that of the three platforms, the Twitter model had the highest adjusted R2, while the Facebook model had the lowest adjusted R2. I am not as surprised that Facebook was the lowest because there seems to be such a wide variety of content on Facebook and with the current trends in social media, I would venture to guess that Facebook followings are not as loyal as Twitter and Instagram followings for the teams.
The other surprising thing I saw were the negative coefficients on rookies for both Instagram and Facebook. This would mean that on average, we expect teams with big-name rookies to have slightly lower engagement rates on these two platforms compared to teams who were not designated as having a headline rookie. This seems counter-intuitive; however, these negative coefficients are extremely small, which is reassuring. Although I continued trying to rework the model to see if I could find a scenario in which the variable had a positive effect, I was unable to do so. I boiled my conclusions down to three likely explanations:
- The rookie variable may have been highly correlated with other variables in the model.
- There may not have been any relationship at all between the rookie variable and engagement rate, in which case we can essentially ignore the coefficient.
- Teams with notable rookies may have significantly increased their content quantity, thus diluting median engagement rates
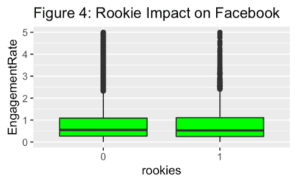
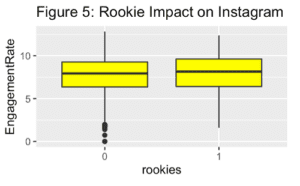
These graphs confirm the second of the three theories: that the presence of a big-name rookie on a team doesn’t affect the engagement rate of a team’s posts all that much, and there is likely no relationship between the rookie variable and engagement rate. To further confirm this theory, I tested how the models would change when the rookie variable is removed from the models. I found that the coefficients on the playoff team indicators barely change, i.e., the model is essentially the same with and without the rookie variable. When I think about what kind of content goes on Facebook, it tends to be more long-form content and highlights from games – content that is not as conducive to showcasing the success of a rookie. In contrast, on Twitter there is much more of an audience for calling out an individual player’s stats and accomplishments, so it makes logical sense that we would expect the presence of a rookie to increase a team’s engagement rates slightly on this platform.
The largest effect I found in my models was that of playoff teams on Instagram. Playoff teams are not only playing deeper into the season, they also have more content to pull from as there is a whole arsenal of playoff content, stats, hype-up videos, and player stories that teams can utilize. This effect is about 11.6 times the effect on Twitter and about 3.3 times the effect on Facebook, which is in part due to Instagram’s already higher engagement rates (see Figure 1) but also may indicate that fans are more engaged on Instagram than Twitter or Facebook during the playoffs.
Lastly, in addition to creating an indicator variable for whether a team made the playoffs, I investigated whether there was a noticeable difference in the overall engagement rates of posts on each platform in the later part of the season, namely Week 10 (11/11/2020) and on. The end of the season is the final stretch for teams to make a push for the playoffs, so I wondered if engagement rates substantially picked up on social as teams neared the end of the regular season. I created another subset for the data that only contained social posts from Week 10 on, and within that new data frame I subsetted once again by platform to compare each platform’s median engagement rate across the entire season with the median engagement rate just during the playoff push period. While the total median engagement rate across all three platforms was higher during this last push of the season (see Figure 6), it is more helpful to break this down by platform to see where the increase is coming from. As can be seen below from Figures 7-9, the overall increase comes from Twitter. I was surprised to see that there was virtually no difference on Instagram and Facebook. There was a slight increase in engagement rates on Twitter of about 11%, which is consistent with where I would have expected the increase to land. This is useful information for teams to have, as it indicates that their fans are engaging with content on Twitter by a noticeably higher margin during this last part of the season. Finally, I was not surprised to see that across the entire season playoff teams had a median engagement rate that was 21% higher than the league, and playoff teams’ pushes had a median engagement rate that was 18% higher than that of non-playoff teams. This is consistent with additional visuals I explored in my EDA process. Since the changes by platform were minimal when looking at Week 10 and on, I reran my analysis looking at Week 13 (12/2/20) on, and I did observe a slight increase in the median engagement rate margin on Facebook by about 0.02. Instagram and Twitter did not change. The below figures show data from the entire season compared to the playoff push period, which is designated as Week 10 and later.
V. Conclusion
Even though the Bucs were crowned the champions of the league on the field, off the field they were outperformed on social media by the Chiefs and the Steelers with stiff competition from the Packers and the Bills. The Chiefs and Steelers specifically saw tremendous success in not only generating a high engagement rate across all their platforms; they were able to consistently outperform the rest of the league while taking advantage of storylines surrounding their top players. Overall, I found that having a big-name rookie on a team was not a strong indicator of engagement rates on Facebook and Instagram, but it did have a positive effect on Twitter. Playoff teams saw an increase in their engagement rates across all three platforms, with the largest increase coming on Instagram and the smallest increase on Twitter. From Week 10 on, median engagement rates increased by about 11% on Twitter, but Instagram and Facebook had virtually no change. Throughout the season, playoff teams had a median engagement rate across all three platforms that was about 20% higher than the rest of the league.
This season was arguably the most important year yet for teams on social, as they were forced to pivot to utilize social media more so than ever before to connect with fans and keep them engaged. With the vast losses in income due to the lack of ticket sales, teams needed to find new ways to generate revenue, retain fan bases, and put themselves in a position to still be successful in coming years. Ideally, in the future teams will combine this virtual medium of connecting with fans with in-person events and experiences, thus creating more opportunities to generate revenue and increase fan engagement.